UML diagrams
Four diagrams visualize the BeCoMe implementation from different angles.
Contents
- Class diagram
- Sequence diagram
- Activity diagram
- Activity diagram: simplified
- Regenerating diagrams
- Related
Class diagram
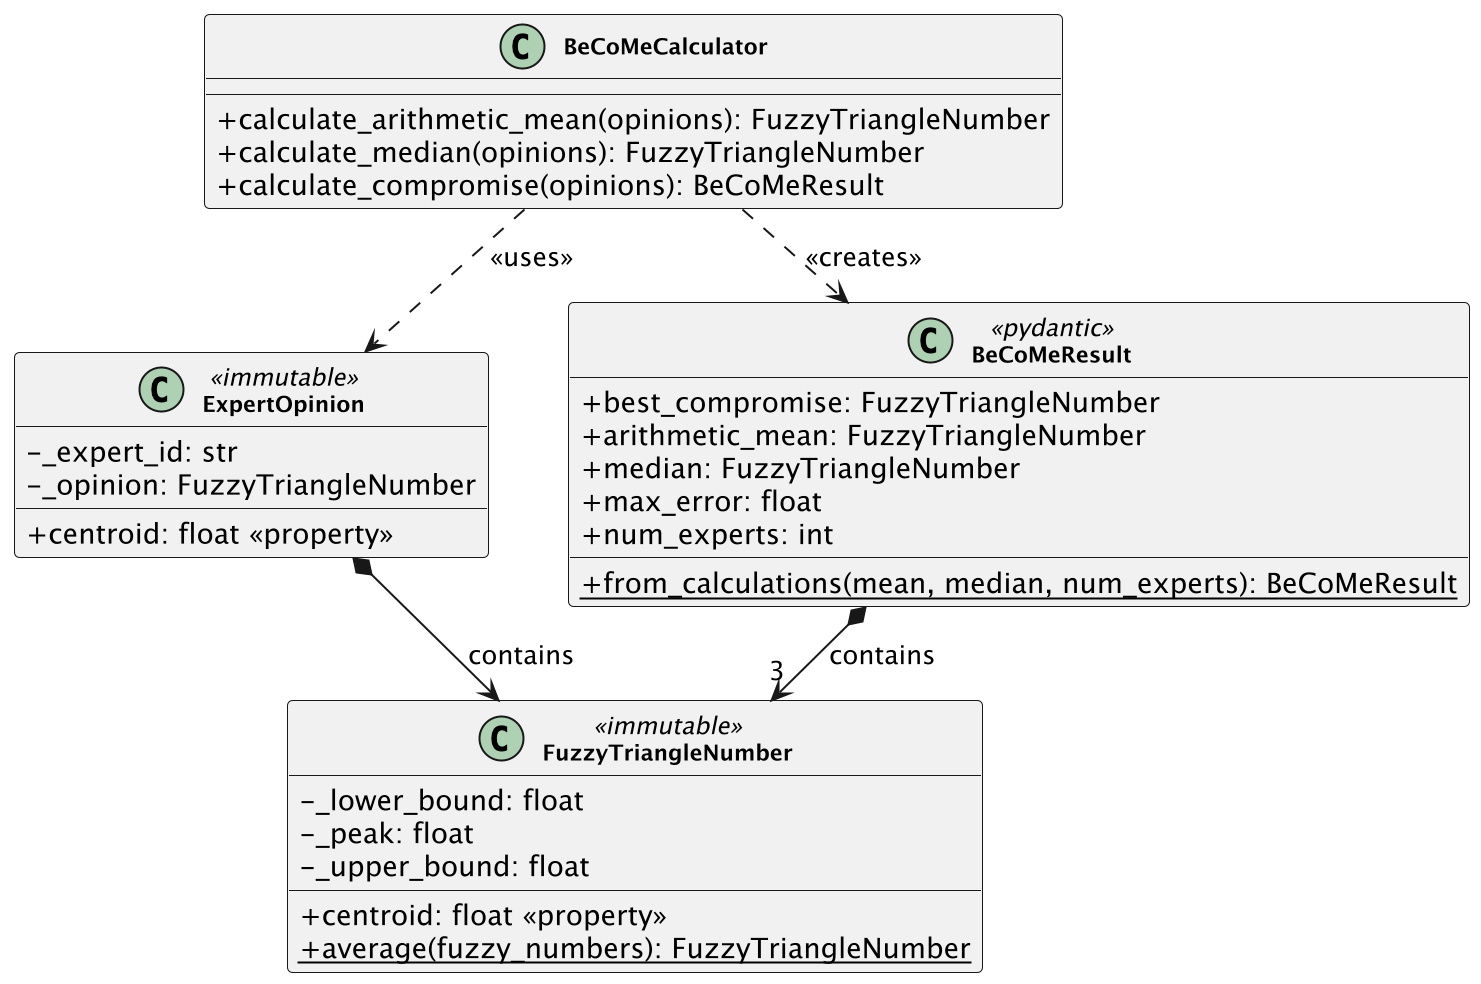
Static structure of the codebase. FuzzyTriangleNumber holds three floats (lower bound, peak, upper bound) and calculates its centroid. ExpertOpinion wraps an expert ID with their fuzzy assessment. Comparison operators use the centroid, which is what makes the opinions sortable for the median.
BeCoMeCalculator does the actual work: arithmetic mean, median, and the combined compromise. Results go into BeCoMeResult, a Pydantic model with the final fuzzy number plus intermediate values and error metric.
Composition arrows show containment (ExpertOpinion contains FuzzyTriangleNumber). Dashed arrows show dependencies (calculator uses opinions, creates results).
Sequence diagram
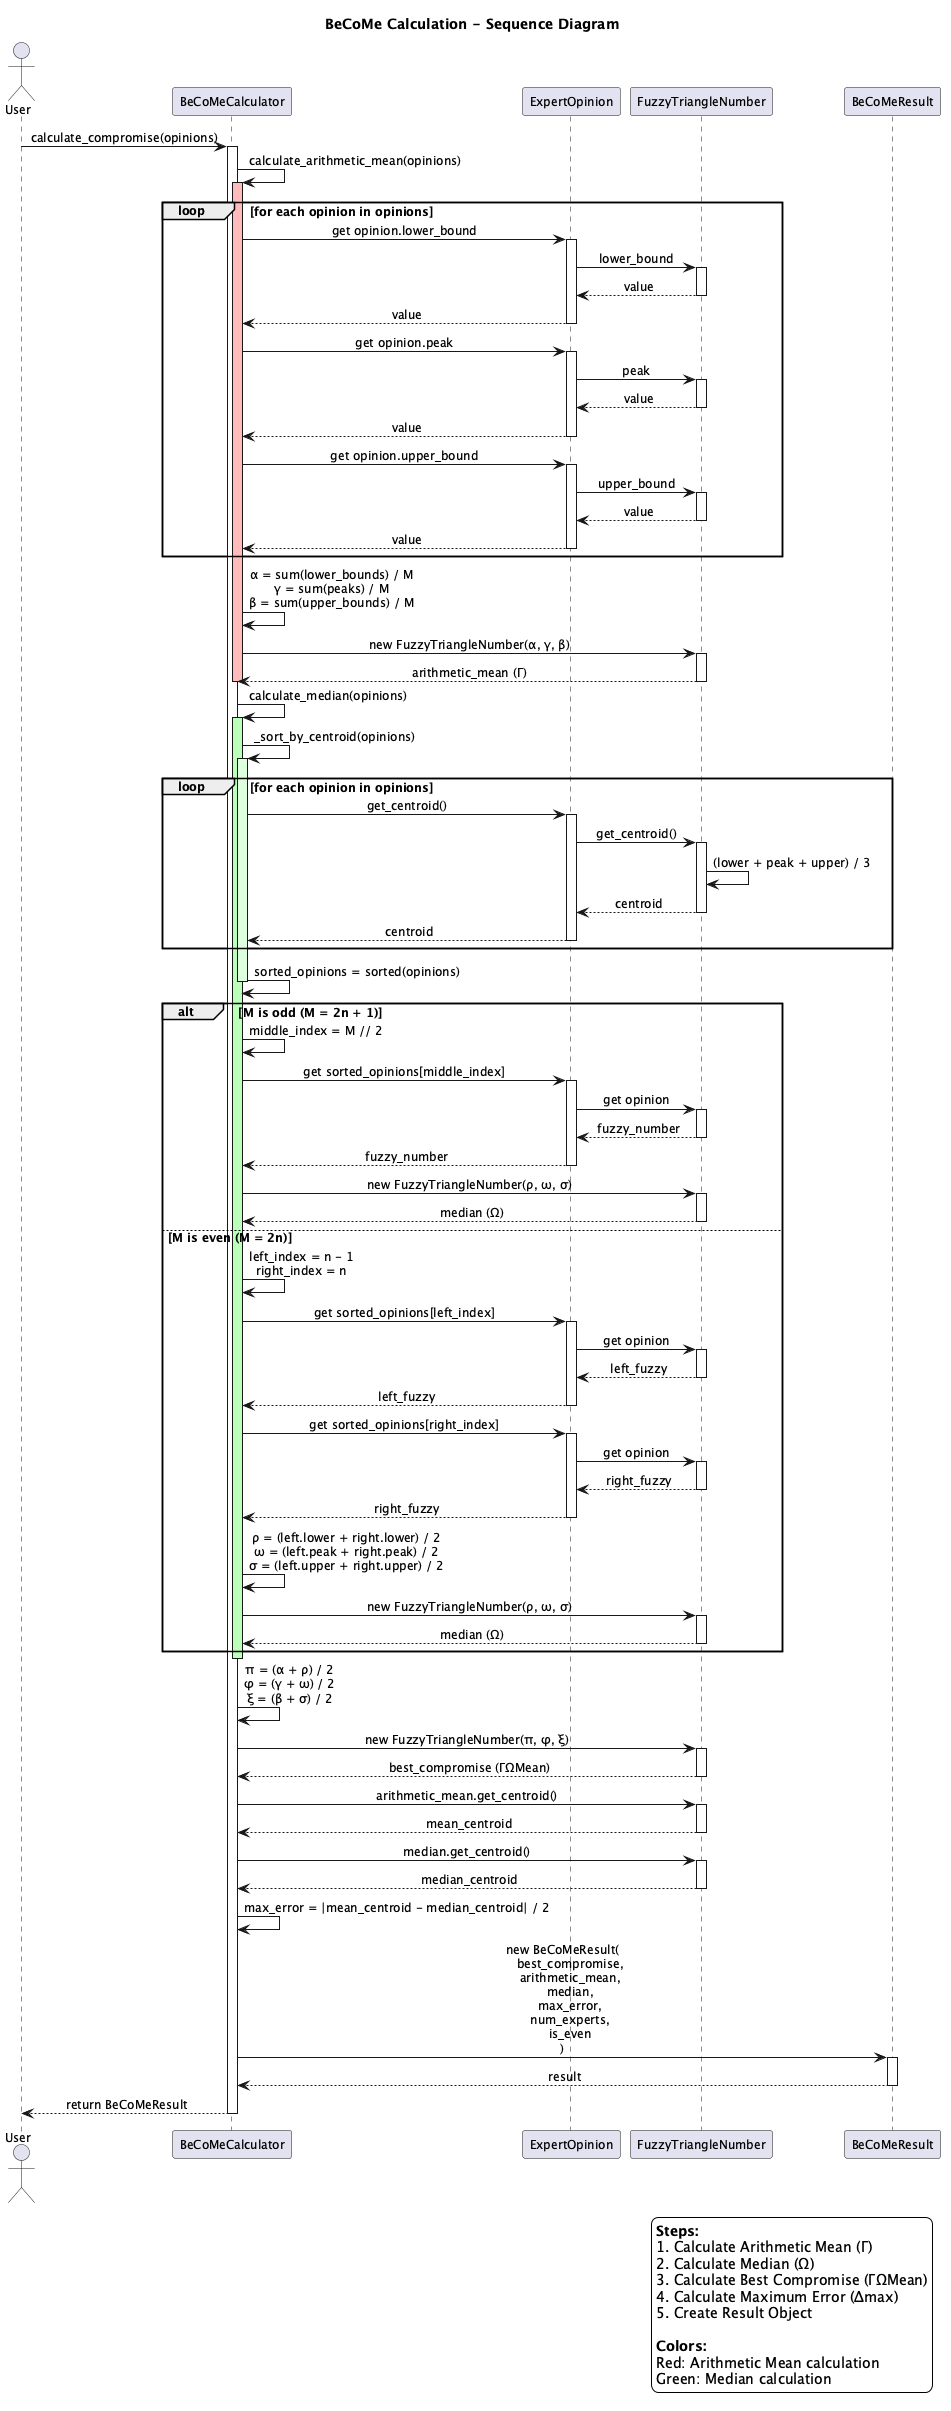
Message flow during calculate_compromise(). The calculator first loops through opinions to compute the arithmetic mean: it averages lower bounds, peaks, and upper bounds separately. Then it sorts opinions by centroid and picks the middle element (or averages two middle elements for even counts).
With both Γ and Ω computed, the calculator averages them component-wise to get ΓΩMean. Maximum error is half the distance between mean and median centroids. Everything gets packed into BeCoMeResult and returned.
Activity diagram
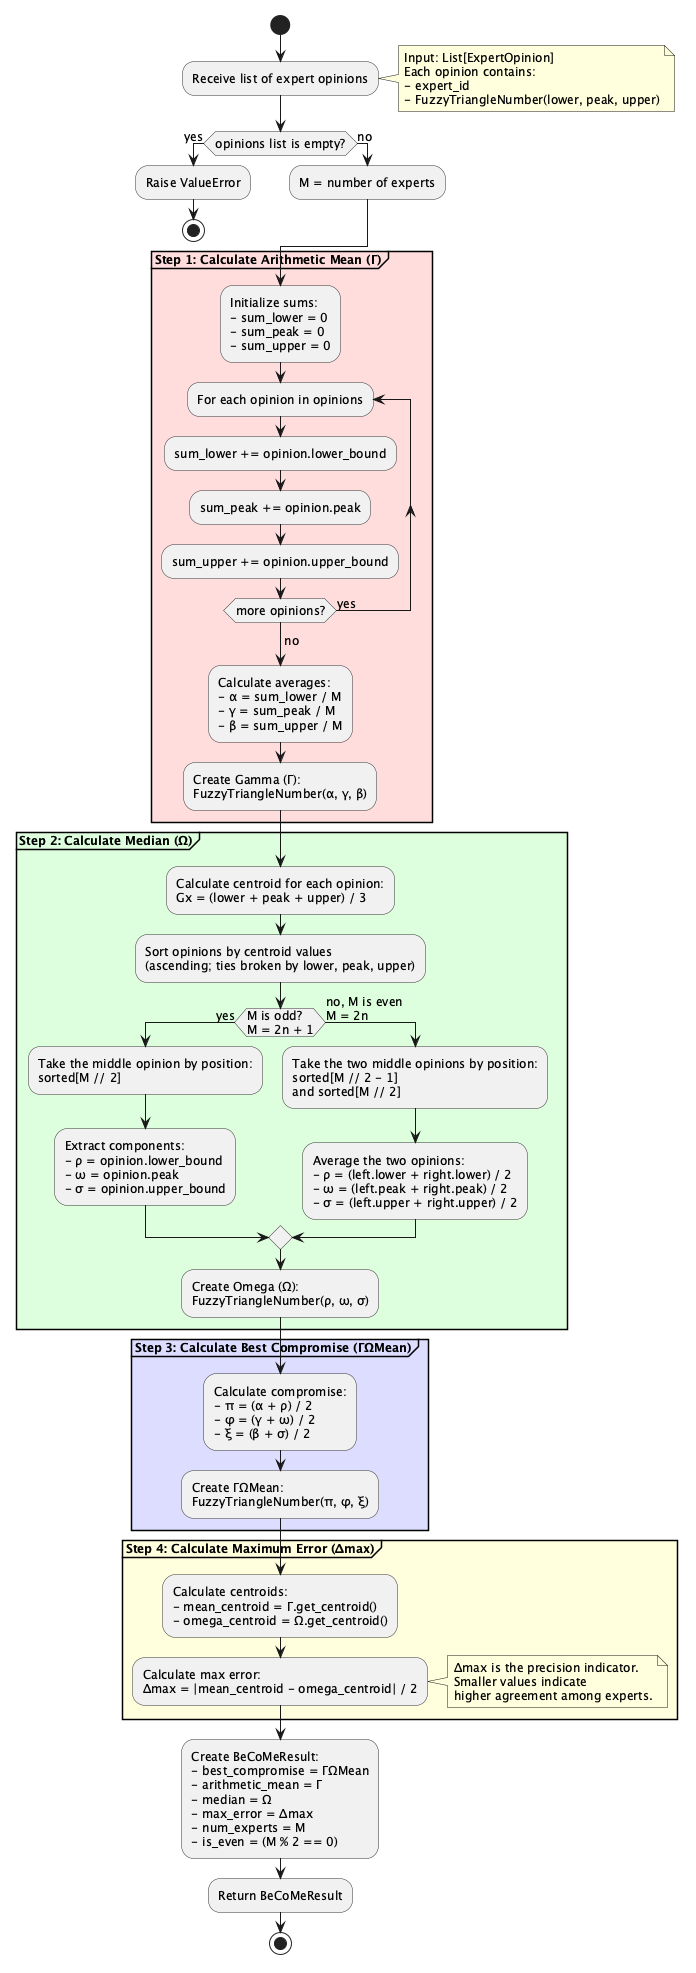
Algorithm flow with decision points. The odd/even branch in median calculation is the main fork: odd counts take the middle element directly, even counts average two neighbors. Color-coded partitions separate the four calculation phases: mean (red), median (green), compromise (blue), error (yellow).
Activity diagram: simplified
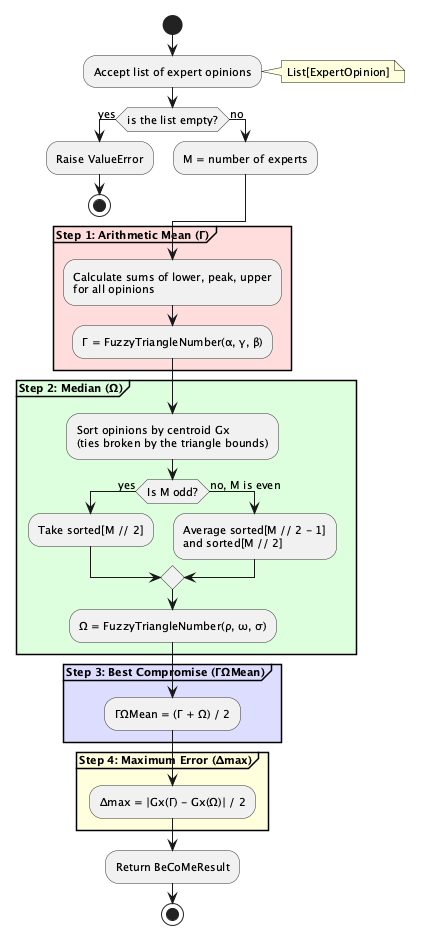
The same flow as above with the per-component arithmetic collapsed into one step per phase. Read this one first, and the full version when you need the exact operations.
Regenerating diagrams
Source files live in diagrams/puml/. To regenerate PNGs:
uv run python docs/uml-diagrams/generate_diagrams.py
Requires plantuml CLI installed locally (brew install plantuml).
Related
- Method description: mathematical formulas
- Source code: implementation details