Reading the result
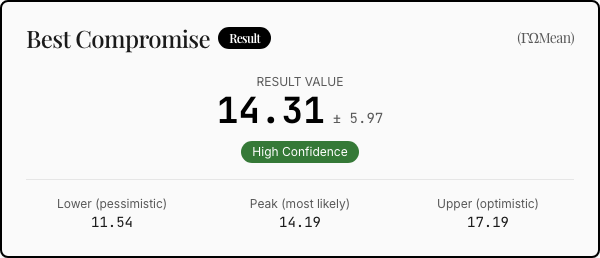
You get four numbers and a chart. Three of the numbers are candidate answers and the fourth tells you how far apart they landed.
The four figures
Best compromise (ΓΩMean) is the answer, and it is precisely the midpoint of the other two: each of its three components is the average of the mean's and the median's. It refuses to choose between them. This is the figure to quote.
Arithmetic mean (Γ) averages the opinions component by component: all the lower bounds together, all the peaks together, all the upper bounds together. It uses every opinion, which is its virtue and its flaw. One expert at an extreme drags it.
Median (Ω) sorts the opinions by centroid and takes the middle one. It ignores how far out the extremes are, so an outlier cannot drag it. That is its virtue, and its flaw is the same: it also ignores a genuine minority.
Maximum error (Δmax) is not an error in your data. It is the distance between the centers of the mean and the median, halved, which is also exactly how far the compromise had to travel from each of them. When the panel agrees, both land in the same place and Δmax is near zero. When the two land apart, Δmax is the price of reconciling them.
Δmax is read against your scale, never on its own, and the app does that for you. It divides Δmax by the width of the scale and labels the result: up to 20 percent is High Confidence, up to 40 is Moderate, beyond that is Low. The label says how close the mean and the median are, not whether the experts agree. A Δmax of 6 is 6 percent of a 0 to 100 scale and 0.06 percent of a 0 to 10000 one, and those are not the same finding.
Now the part that catches people, including me. A small Δmax does not mean the panel agreed. Δmax measures how far apart the mean and the median landed, and those two can land close together on a panel that is deeply split, because the mean sits between the camps while the median sits inside one of them. The worked example is exactly that case: two camps forty points apart, and the app reports High Confidence, correctly by its own rule.
Which is why the chart is not decoration.
What the chart shows
The horizontal axis is your scale. The vertical axis is membership, running from 0 to 1: how strongly a value belongs to an opinion. A triangle peaks at 1 at the expert's most likely value and falls to 0 at the bounds.
Grey triangles are individual opinions. The blue dashed line is the arithmetic mean, the green dashed line the median, and the solid black line the best compromise. Turning on Show individual opinions puts the grey triangles behind the result, and that view answers the question the numbers cannot: whether your panel is one group with some spread, or two groups with a gap between them.
Those two situations can produce the same compromise. They do not mean the same thing.
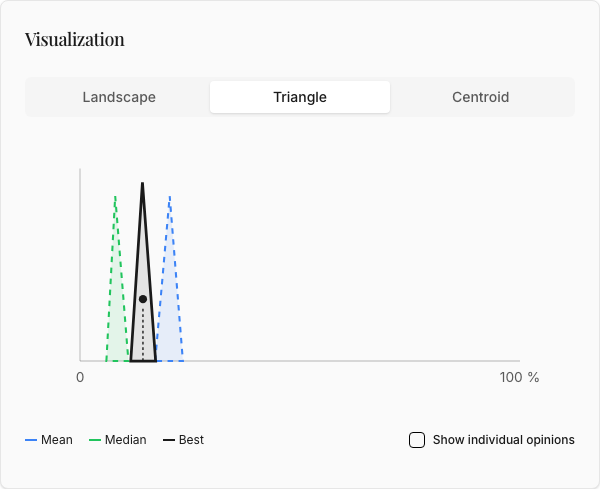
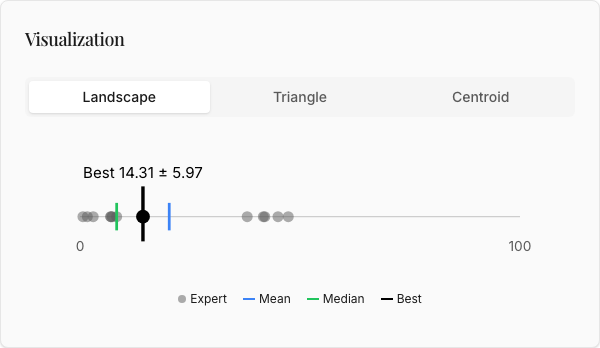
The same result in the other two views. Landscape is what opens by default, and Centroid collapses each opinion to a single point, which turns a crowd of overlapping triangles into something you can count.
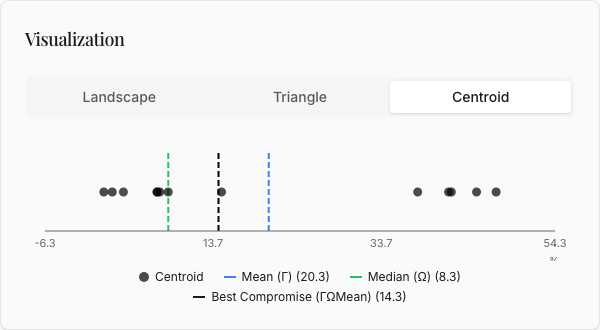
On this panel the centroid view is the one that settles the argument. Thirteen dots, two clusters, nothing in between, and the mean sitting out in the empty middle where no expert put anything.
The agreement mode is not finished
The method has a second mode for "should we" questions rather than "how much" ones. A project whose scale runs 0 to 100 with no unit is read as an agreement scale, and the compromise is rounded to one of five positions, from strongly disagree to strongly agree.
None of that reaches you yet, and it breaks in three separate places. The create form will not accept a project without a unit, so such a project cannot be made at all. The interface never displays the position, even when one is computed. And the recommendation sentence the core library writes for each position is dropped before it leaves the API. The pieces exist and are tested individually. They are not joined up, and this page will say so until they are.
Words used on this page
Fuzzy triangular number. Three values, lower and peak and upper, forming a triangle. It says both what you think and how sure you are.
Centroid. The center of gravity of a triangle, (lower + peak + upper) / 3. It collapses a
fuzzy number back to one figure when you need to sort or compare.
Membership function. What the vertical axis measures. Membership is 1 at the peak and falls linearly to 0 at each bound.
Next: a worked example, where these four figures come from a real panel of thirteen.